Posted by: usset001 | July 24, 2015

New games available on Commodity Challenge

Commodity-Challenge

Earlier today, I started seven new “open” games in Commodity Challenge. Open games are not protected by a password, and they are available for anyone to join.

The first step for anyone to play is to register with Commodity Challenge at http://www.commoditychallenge.com. Check the HELP section for how to instructions, but I think you will find it to be very intuitive. Once you are registered, you can access the game from your home page. Simply select “FIND A GAME” in the upper right.

Illinois New Crop Open (corn and soybeans)

Iowa New Crop Open (corn and soybeans)

Nebraska Buyers Challenge (buying corn for a livestock operation)

Minnesota Buyers Challenge (buying corn for a livestock operation)

Kansas HRW Wheat Challenge

Oklahoma HRW Wheat Challenge

Colorado HRW Wheat Challenge

Join a game and practice something different; a new marketing plan or a new pricing tool. It’s a chance to learn and improve.  Good luck!

Posted by: usset001 | June 30, 2015

Pricing 2015 corn

corn clip

After months and months of waiting, a rally comes (finally) to the corn market. Dec’15 futures prices at $4.31½ have returned to levels not seen since last December. Last February, I had the chance to speak at Commodity Classic in Phoenix. I told hundreds of farmers gathered at 7:00 a.m. that I believed the market for Dec’15 futures – then trading at $4.15 per bushel – had a good chance of returning to December highs closer to $4.40 per bushel. What followed was not a rally, but four months of lower prices and heartbreak, as Dec’15 corn sank to $3.65. I promised myself that a rally back to $4.25 must be sold, because I hate going into harvest with nothing on the books.

(You can find my pre-harvest marketing plans posted here. It may take a few days to get my latest corn changes posted.)

December corn at $4.315/bu. will not cover all production costs, and it is below my minimum price objective. However, it is high enough to catch my attention and minimize losses (also known as Plan B – what we do when maximizing profits does not appear to be in the cards). I will take the opportunity to price 25,000 bushel of 2015 crop with the sale of five contracts of Dec’15 corn futures. This represents about 25% of my expected crop.

Yes, I have my eye on soybeans and spring wheat. Today, Nov’15 soybeans closed at $10.37/bu. and Sep’15 spring wheat at $6.37/bu. I would like to see $10.50 and $6.60, respectively, to get started with pricing these crops.

As always, I must hope that my first sales are my worst sales.

Posted by: usset001 | May 11, 2015

2015 Pre-Harvest Marketing Update

barneybinless

I get questions concerning the pricing of the 2015 crop. Here’s one I received this morning, and it will show where I am today.

Question: We look at your information in our marketing groups.   We were wondering what the plan is for 2015 crop is it stay below you breakeven price?   Will you wait until post harvest to do all of your sales?

My response: You are watching me closely, and you are correct in noting that I have done nothing in the way of pre-harvest marketing for 2015. I have been waiting patiently for some sort of a bounce; and opportunity to get started, even if prices are below production costs. So far, all I’ve received is a kick in the teeth as prices drift lower.

I do not like to go into harvest with nothing done beforehand, but I am ready to do so if we can’t find a rally in the current market. Let me give you my ideas on what I consider “higher.”
Dec’15 corn: currently at $3.75, I was hoping for $4.25 to get started.

Nov’15 soybeans: currently at $9.50 – show me $10.50!

Sep’15 HRS wheat: $5.50 today, but I want one more shot at $6.25
The only way we will get these prices is something bullish in the market – weather related problems during the growing season to be specific. If something gets started on the upside, I may just try to follow the trend higher with a simple moving average. But I need something to get it started (and ideal planting conditions is not much help).
Patience! (I hear it’s a virtue).
Posted by: usset001 | May 7, 2015

Minnesota trend-line soybean yields in 2015

MN soybean yields 1985 2015

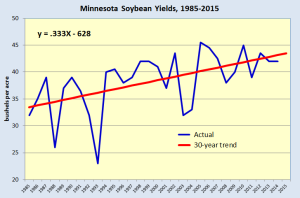
What can we expect for soybean yields in Minnesota in 2015? Extending the trend over the past 30 years indicates a trend-line yield of 43.5 bu./acre. The record for Minnesota soybean yields was set 10 years ago, when the state average 45.5 bu./acre in 2005. It is interesting to note that in 5 of the last seven years, Minnesota had below trend yields. Oddly enough, 2012 was one of the two years when yields were above trend – a year noted for its butt-kicking drought throughout the rest of the Corn Belt.

Note the slope of the trend-line, 0.333X. It’s another way of saying that Minnesota soybean yields have been improving by an average of 1/3 bu./year over the last 30 years.

Posted by: usset001 | May 5, 2015

Minnesota corn planting off to a fast start

cornfieldThe crop progress report released yesterday said that Minnesota farmers had 83% of their corn planted as of the week ending May 3. This figure places 2015 as one of top 6 Minnesota years in corn planting progress since USDA began tracking it in 1979, 37 years ago.

The following tables shows other early planting years in Minnesota. In each of these years, the MN corn crop was at least 80% planted as of the week ending May 3-9.

% planted as of May 3-9 MN Trend Yield Actual Actual vs. Trend
1998 81 137.3 153.0 15.7
2000 93 142.4 145.0 2.6
2003 80 150.0 146.0 (4.0)
2004 90 152.6 159.0 6.4
2010 94 167.8 177.0 9.2
2015 83 174.9 na na
average 154.2 156.0 6.0
Posted by: usset001 | May 4, 2015

Corn prices in the 2015/2016 marketing year

corniconOn Friday, Dec’15 corn futures closed at $3.80/bu., placing May 1 new crop quotes at their lowest level since 2007 (on May 1, 2007, Dec’07 futures were quoted at $3.79). With Dec’15 futures near $3.80 and deferred 2016 contracts (March, May, July and September) trading at $3.90 – $4.05/bu., the futures market is forecasting a national average corn price of $3.95/bu. for the 2015/2016 marketing year. This figure is 25-35 cents lower than the fundamental outlooks presented recently by three different Universities.

On April 16, 2015, Dr. Darrel Good and Dr. Scott Irwin wrote a piece for Farmdoc titled, “Projecting the 2015-16 Corn Balance Sheet and Price Implications.” They project the an average corn price of $4.25/bu. Drs. Good and Irwin use a trend projection of 164bu./acre for corn in 2015.

The latest AgMRC (Agricultural Marketing Resource Center) Renewable Energy & Climate Change Newsletter was released on April 27. In this newsletter, Dr. Robert Wisner, a biofuels economist at AgMRC, offered his take on corn supply and demand and prices in 2015. Assuming a national corn yield of 165 bu./acre, he projects a national average corn price of $4.20/bu. in 2015/2016.

On April 30, writing for AgManager.info, Dr. Daniel O’Brien, Agricultural Economist at Kansas State University, offered a “normal crop” price projection of $4.30/bu. KSU is using a long term trend yield of 162.3 bu./acre for 2015.

All three of these projections have one thing in common; a subdued view of long-term trend yields for corn. Corn plantings are off to a very good start and, today, a rosier outlook for yield rules.

Posted by: usset001 | May 1, 2015

Minnesota yield expectations for corn in 2015

MN corn yields 1985 2015

USDA, NASS data

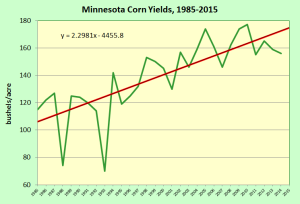
What can we expect for corn yields in Minnesota in 2015? Extending the trend over the past 30 years indicates a trend-line yield of 174.9 bu./acre. USDA data tells us that the record for Minnesota corn yields was set in 2010, when the state average 177 bu./acre. It is interesting to note every year since 2010 – the past four years (2011-2014) – Minnesota has had 4 consecutive years of below trend yields. We need to go back to the Dust Bowl of the 1930’s for the last time that was true.

The drought of 1988 stands out in this chart, as does the short crop of 1993, caused by excessive water and cooler temps. My friend Dr. Elwynn Taylor once described the year as a great example of “lots of growth, but no development.” The drought of 2012 does NOT stand out in this chart – Minnesota corn yields were very good relative to the rest of the drought ravaged Corn Belt states.

Note the slope of the trend-line – 2.29X – it’s another way of saying that Minnesota corn yields have been improving by an average of 2.3 bu./year over the last 30 years.

Posted by: usset001 | April 23, 2015

How much corn does a turkey eat?

turkeyMinnesota is the top turkey producing state in the country. Turkeys have been affected by the bird flu, with outbreaks making the news on almost a daily basis. It has myself and many others thinking about the impact on corn demand.

At University of Minnesota Extension, Sally Noll is the program leader for our Poultry Production and Health group. These notes are a summary of my conversation with her last week.

The turkey market is ½ hens and ½ toms. About 1/2 the hens are raised for 8-10 weeks, reaching weights of 12-14 pounds. The other half are raised to to 18-20 pounds. The toms are raised for 20-22 weeks, reaching weights of 40+ pounds. Hens and toms are raised in separate barns and, from what I have read so far, reports have not identified the sex of lost birds. At this point I would assume a 50-50 loss of hens and toms, and we will assume an average size of 28 pounds per turkey.

A 2:1 ratio of the amount of feed eaten to body weight gain appears to be a valid assumption. The feed ration is 55-60% corn, with the balance soybean meal, minerals and vitamins, animal protein byproducts, canola meal, sunflower meal. As of last week, Minnesota had lost about 1.4 million turkeys.

Let’s do the math. How much corn would 1.4 million turkeys consume in an entire production cycle?

1.4 mil. turkeys * 28 lbs./turkey * 1.2 lbs. corn/lb. turkey)/56 lbs./bu. corn = 840,000 bushels of corn

That looks like a pretty big number, but the math is not quite that simple. The loss to feed demand involves more than the loss of the current birds. How long will a shuttered facility not produce? One cycle (10-22 weeks)? Two cycles (20-44 weeks)? A year? I don’t know the answer, but we must consider how many production cycles have been lost.

I can put a little perspective on 840,000 bushels by contracting the amount of corn used in turkey production to the amount of corn used in ethanol production. Minnesota has 21 ethanol plants, and the average plant produces a little more than 1 million gallons each week (about 60 million gallons of ethanol each year). Assuming 2.8 gallons of ethanol from each bushel of corn, the average Minnesota ethanol plant processes nearly 400,000 bushels of corn each week.

In other words, the average ethanol plant in Minnesota will process 840,000 bushels of corn in a little more than two weeks.

wheatfieldYesterday I read an article from The Globe and Mail titled, “Kraft, Mondelez accused of manipulating prices of wheat used in Oreos.The article was written by Michael Babad and you can find it here. You can find the CFTC press release here.

As a former futures trader and hedger who worked for a large food company, I take a particular interest in this topic. To have the CFTC (the Commodity Futures Trading Commission) accuse you of price manipulation is pretty serious stuff. Allow me put a little perspective around the numbers and the allegations.

The Toledo flour mill, owned by Mondelez Global LLC, is one of the largest flour mills in the world, with a daily milling capacity of 31,000 cwts of flour per day. My Sosland Grain & Milling Annual indicates that all of that capacity was dedicated to milling soft red winter wheat – the type of wheat used to produce low protein flour favored in the production of cookies like Oreo, Chips Ahoy, etc. Assuming 2.3 bushels of wheat per cwt of flour, and a mill running 310 days per year (normal industry standards), the Toledo mill processes over 22 million bushels of SRW wheat each year. The article I’m reading says “It [Kraft] uses about 30 million bushels of wheat a year for products like Orea, Chips Ahoy, Ritz, Triscuit and Wheat Thins. And the bulk of that wheat, generally sourced in Ohio, Indiana, Michigan and Ontario, is milled in Toledo.” Twenty-two million bushels is the bulk of 30 million bushels, so my math is in agreement with the facts put forth in the article.

Here’s where I am confused and need clarification. To quote the article (which appears to be quoting from the CFTC report), “The CFTC alleges the companies bought six months’ worth of wheat futures amid a rise in costs in 2011, but never planned to take delivery, the goal being a drop in prices on the cash market.” Call me confused with the statement that the company “never planned to take delivery.” I don’t know of any commodity buyer – buying futures contracts to hedge against higher input costs – who would actually want to take delivery on the futures contract. When a buyer of commodities buys futures contracts, they do so to hedge against higher prices, not to take delivery. General Mills (another large food company) for example, may choose to buy wheat, sugar, or soybean oil futures to hedge against higher food input costs. I can assure you that when they buy these contracts, they have absolutely no intention of “taking delivery.” The same can be said of a large airline buying crude oil contracts to hedge against higher fuel costs. Hedging is, by definition, taking a position in the futures market as a temporary substitute for a later transaction in the cash market. Like any other hedger of flour costs, once the long hedge is in place, they would later buy cash wheat to mill, and offset their long futures position as the wheat is purchased.

The article also says, “Kraft also held futures positions above the speculative limits, according to the complaint.” In my mind, Kraft sounds like a hedger, buying wheat futures to hedge against higher input costs. They are said to have bought $90 million of wheat futures. $7 futures ruled in 2011, so $90 million in futures equates to about 13 million bushels – less than half of the 30 million bushels used each year. Clearly, I may be lacking some important details here, but an ownership position of about 40% of your annual usage is, at best, modestly aggressive. I am aware of examples of food companies using futures markets to secure costs on inputs for as much as a full year out. Whether or not that exceeds speculative limits gets into the CFTC definition of hedging. This may be a tricky question. A large merchandiser of SRW wheat, with millions of bushels in storage (and physical proof of the holdings), can legitimately sell an equal amount in the futures to hedge their ownership. A food company buying futures is hedging anticipated sales in the future, and I simply don’t know how the CFTC approaches such anticipatory hedges. All I can say is that food companies regularly buy futures contracts (or a variation with options) to control input costs.

One more quote from the article and the CFTC document. “In developing the strategy, Kraft, acting through certain of its procurement staff and certain senior management, intended that the futures market would react to its enormous long position by increasing the price of the December 2011 futures contract while reducing the differential between the December futures price and the price of the cash market wheat.” This comment speaks to a basis play on the part of Kraft (and, actually, the desire may be to increase – not reduce – the differential between futures and cash, but it depends on whether the basis is positive or negative). By owning futures, Kraft is, in essence, short the basis. The quote seems to indicate that Kraft was manipulating the basis. To be clear, they would benefit from a widening basis – lower cash prices relative to the futures price. Here I can only say that I traded the spring wheat basis for a number of years, and I have no idea how anyone could think they would manipulate the basis. Anticipate a lower basis? Yes. Put yourself in a position to benefit from a lower basis? Yes. Manipulate? Please tell me how – what I’ve read so far leaves me in a fog.

One final thought. I don’t know how Kraft is structured. I once worked for a large miller, which was itself a small part of a large food company. I worked for the milling division which had its own P&L. The procurement function was a completely different part of the company. We used futures contracts every day to hedge our risks in the milling division. The procurement group also regularly used futures contracts to hedge flour costs. There was remarkably little coordination and communication re futures positions between the groups. Was the Toledo mill operating separately from a procurement function in Kraft? I don’t know the answer, and I’m not sure if it makes a difference.

My readings so far have left me with many more questions than answers. Stay tuned.

Posted by: usset001 | April 1, 2015

Finished marketing the 2014 spring wheat crop

wheaticonThe basis for HRS wheat has been surprisingly strong, and that’s good news for someone who decided to sell the carry in the spring wheat market. In late August, I made the decision to store wheat and sell the Jul’15 Minneapolis wheat contract, which was trading at a 34 cent premium to the (then) nearby Sep’14 contract. You can see my 2014 post harvest marketing plan for wheat here.

The basis at harvest was 30 cents under the Sep’14 contract, or 64 cents under the Jul’15 contract. I sold the carry with the hope that 64 under the July could narrow to option price the July by spring of 2015. I got my target basis plus some – the wheat basis is currently 15 cents over the nearby May’15 contract, and about 11 cents over the July contract – that’s a 75 cent narrowing of the basis from late August to late March. Wow!

The good news is that 2014 is history. The bad news is that I have yet to start on 2015. All I’m asking for is one good rally from current levels.

Older Posts »

Categories